Known problems with ShipX
On this page
Issue 1: Plotting short-term statistics against peak period
Short term statistics display data in terms of the peak period shown below:
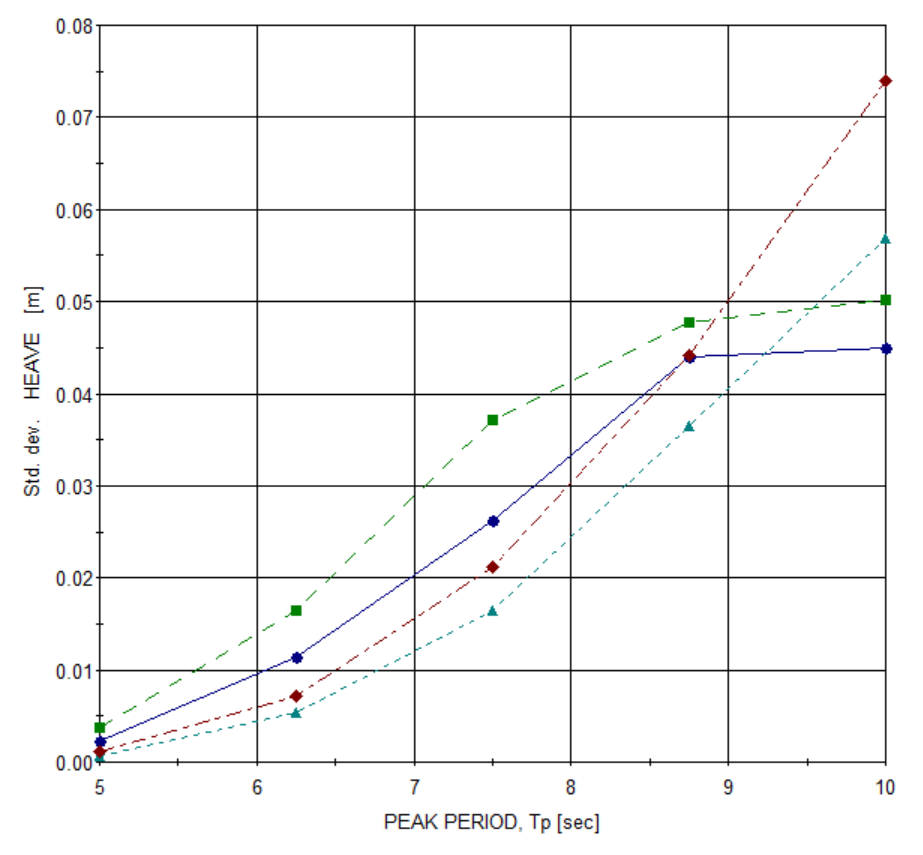
However, this is only when the significant wave height is kept constant for a varying peak period: 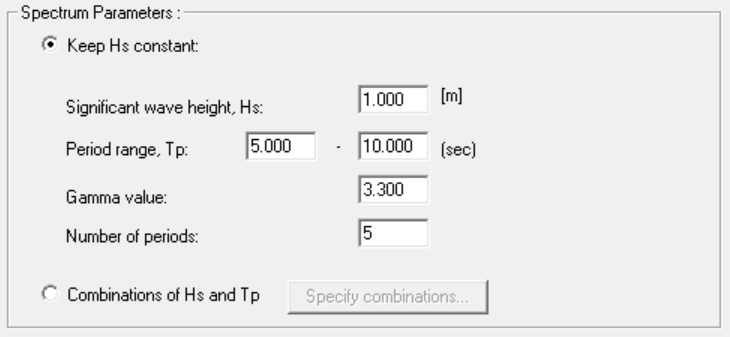
If combinations of significant wave height and peak period are chosen instead, the x-axis becomes Hs, and it is currently not possible to switch to peak period: 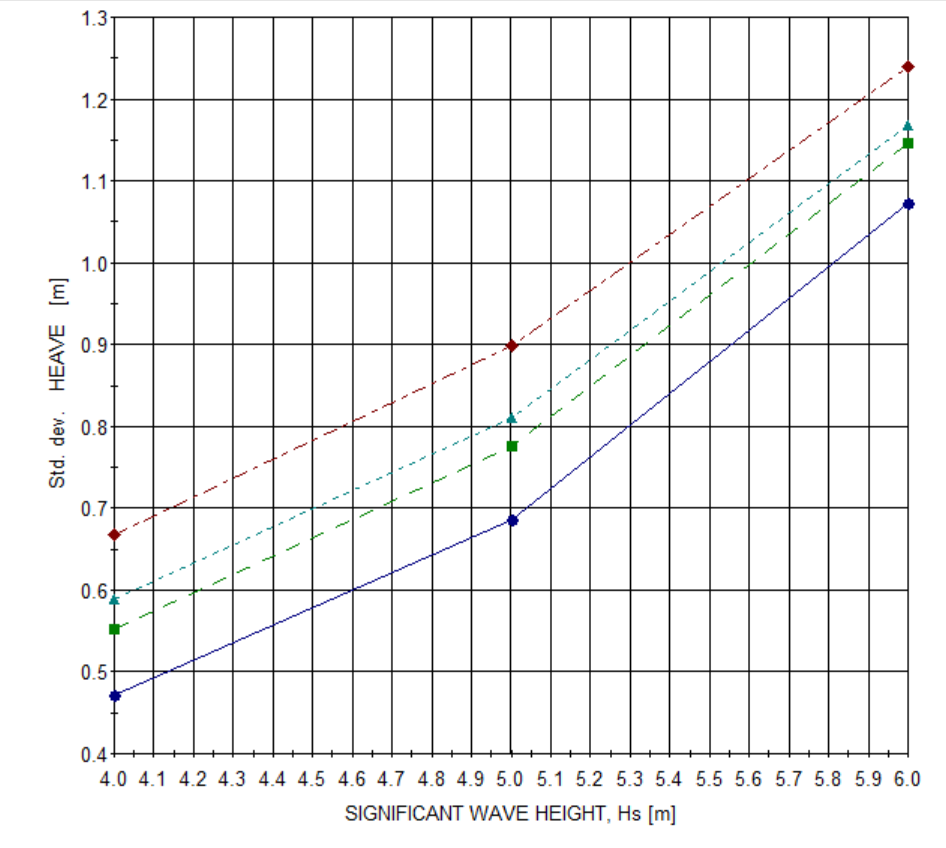
Issue 2:
- Know of an issue with ShipX? Email me, and I will add it to this list!